AP STATS FINAL PROJECT
200 Test Points
You will work in groups of 4 or less
You will be making a.....Music Video
You will be taking a song and changing the lyrics to STATS terms, or you may create a new song.
I would like the beginning of your video to be the original song/video so we know which song you have changed.
You will also turn in a 1-page handout(9 copies..... one of Mr. Pines and 1 for each group)
Handout will be the Lyrics to your video
Make it fun, make it interesting,
You must test your video with me prior to showing it.....put it on flash drive, cd,....something I can show on my MAC, yo may also bring in your own laptop, chromebook is an option too, No You Tube.
Type I Type II Error project(Ch9)
Here is what it must have
- conjecture(must have risk involved)
- hypothesis
- type I error
- type I error consequence
- type II error
- type II error consequence
- which is worse, explain
- what should you make alpha level at
- what is the power of this situation in context
- Picture(make it look nice)
- WORTH 50 TEST POINTS
- DUE on Semester Finals Day or earlier
| type_i_and_ii_template_example.pdf |
Experimental design project
Worth 25 Test Points
Design an Experiment(completely randomized, block, or matched pairs....or combination
Create a new product or experiment on an existing situation or problem
Explain what your product will do or why you are conducting this experiment
Make sure you randomize
8.5 x 11 size....COLOR...typed, laminated if possible, use a computer
Pick something fun
DON'T COPY MY EXAMPLES, use them as a guide and be creative
DUE Wed 11/16
| expdesign_project_jurrasic_park.docx |
| expdesign_project_example.docx |
Music project
| music_project_song_converter__1_.gsheet |
Graphing Calc Picture
Worth 10 Test points. Take any picture/photo and insert a picture of a graphing calculator into it. Best one earns 4 bonus test points. Color is strongly suggested and Laminated would be appreciated
DUE: Fri 9/30
DUE: Fri 9/30
BASEBALL CARD PROJECT(Ch1)
Your project is to create a baseball card of yourself(doesn't have to be sports related, it can be anything.....even your watching tv statistics or sleeping, choose something interesting, make it fun.
Baseball card must look like a baseball card, SAME SIZE AS A BASEBALL CARD, LOOK AT ONE THAT I GAVE YOU.
The front should have your picture doing the activity that you are choosing and your name, that's it!(look at a baseball card)
The back has your height,weight, etc.......also on the back(2 graphs of your choosing: stemplot, boxplot,histogram, etc. TRY TO DO THEM ON THE COMPUTER AND SHRINK THEM DOWN.
Also on the back: CUSS, summary stats(mean,stDev, etc
20 #'s minimum
WORTH 50 TEST POINTS
LAMINATED would be nice.
Due Fri Oct 14th 2016 in class......or earlier.
linear regression t test project(Ch12)(YOU MAY WORK with someone)
Create a paper helicopter(YouTube videos show how to make them, THERE ARE MANY DIFF TYPES)
Worth 1/2 Test
run a linear regression t test(drop height vs time)
experiment with different drop heights(be safe doing this)
sample size at least 10......30 will give you CLT
Interpret r, r-squared, a, b
show scatterplot
show residual plot
must include hypothesis,assumptions,conclusions
include at least 1 picture or video of you testing your helicopter
POWERPOINT or LAMINATED
YOU MUST GIVE ME YOUR DATA, AND YOUR HELICOPTER
EVERYTHING TYPED PLEASE(RESID PLOT CAN BE DONE NEATLY BY HAND OR PICTURE OF CALC SCREEN)
Under my "LINKS" page there is a free scatterplot maker you can use to get an easy screen shot
DUE THU 3/3 or sooner......as soon as its done I will update your grade
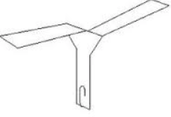
Basic, will work well
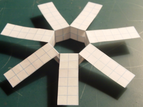
Really cool looking, flies great!
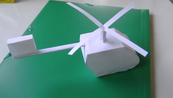
Seen lots of designs like this, not sure if they fly, proceed with caution!
Linear regression project(ch3)
YOU MAY WORK WITH ANOTHER STUDENT
This should be done on ppt or in a notebook folder
You are showing knowledge of a linear relationship between two things(x & y)
Choose a topic of your choice(something you like!)....an example might be x: time spent online vs y: time spent studying or something more fun like x: # of scoops of ice cream eaten in five minutes vs y: severity of ice cream headache....j/k don't do that one!
You MUST give us an introduction to this topic by a short video or pictures(show us detail)...be creative.
You need to use a minimum of 12 data points (x,y)
Things it must include:
your data
scatterplot
residual plot
linear equation written in context
interpet a,b,r,r-squared
DUE Tue Nov 10th or earlier....can be e-mailed to me.
worth 50 test points
CHECK OUT THE EXAMPLE BELOW
| super_mega_baseball_regression_project.pptx |
6-sided die project(Ch7)
Create a 6-sided die out of any material of your choosing.
Must be softball size or smaller.
Must be numbered CORRECTLY 1 to 6.......take a look at a real die.
Must be strong enough to last about 3 months......don't use lined paper.
WORTH 25 TEST POINTS
DUE TUE NOV 17th
| probability_project_mini.pdf |
| bad_graph_mini_project_.doc |
| bad_graph_examples.pptx |
experimental design project(ch4)
You need to conduct a survey(easier) or an experiment(this one is harder)
Your survey or experiment results(answers) must be quantitative(something that can be put into 1 list on your calculator
You may work with a partner....or alone
Choose a VALID sampling method(SRS,Stratified, Cluster, Systematic)
Show me how you randomized(dice,cards,names in hat...etc)
I want to see a video clip or pictures showing info about your topic, randomization process, or taking the survey)..be creative
No more than 2 min to your video.
Your results must be summarized(put in calc...1-var stats....MUST include(mean,StDev, 5#-summary)
CUSS(in a paragraph in context)
Make 2 graphs displaying your results
Make a PREDICTION and CONCLUSION
DUE Thu Nov 19th or earlier....can be e-mailed to me.
worth 50 test points